
Used primarily throughout post-merger integration projects, DealRoom's Gantt chart serves as an interactive map and provides a clear, visual timeline for your tasks, their dependencies, and progress, aiding in the coordination, planning, and execution of complex dealmaking strategies.
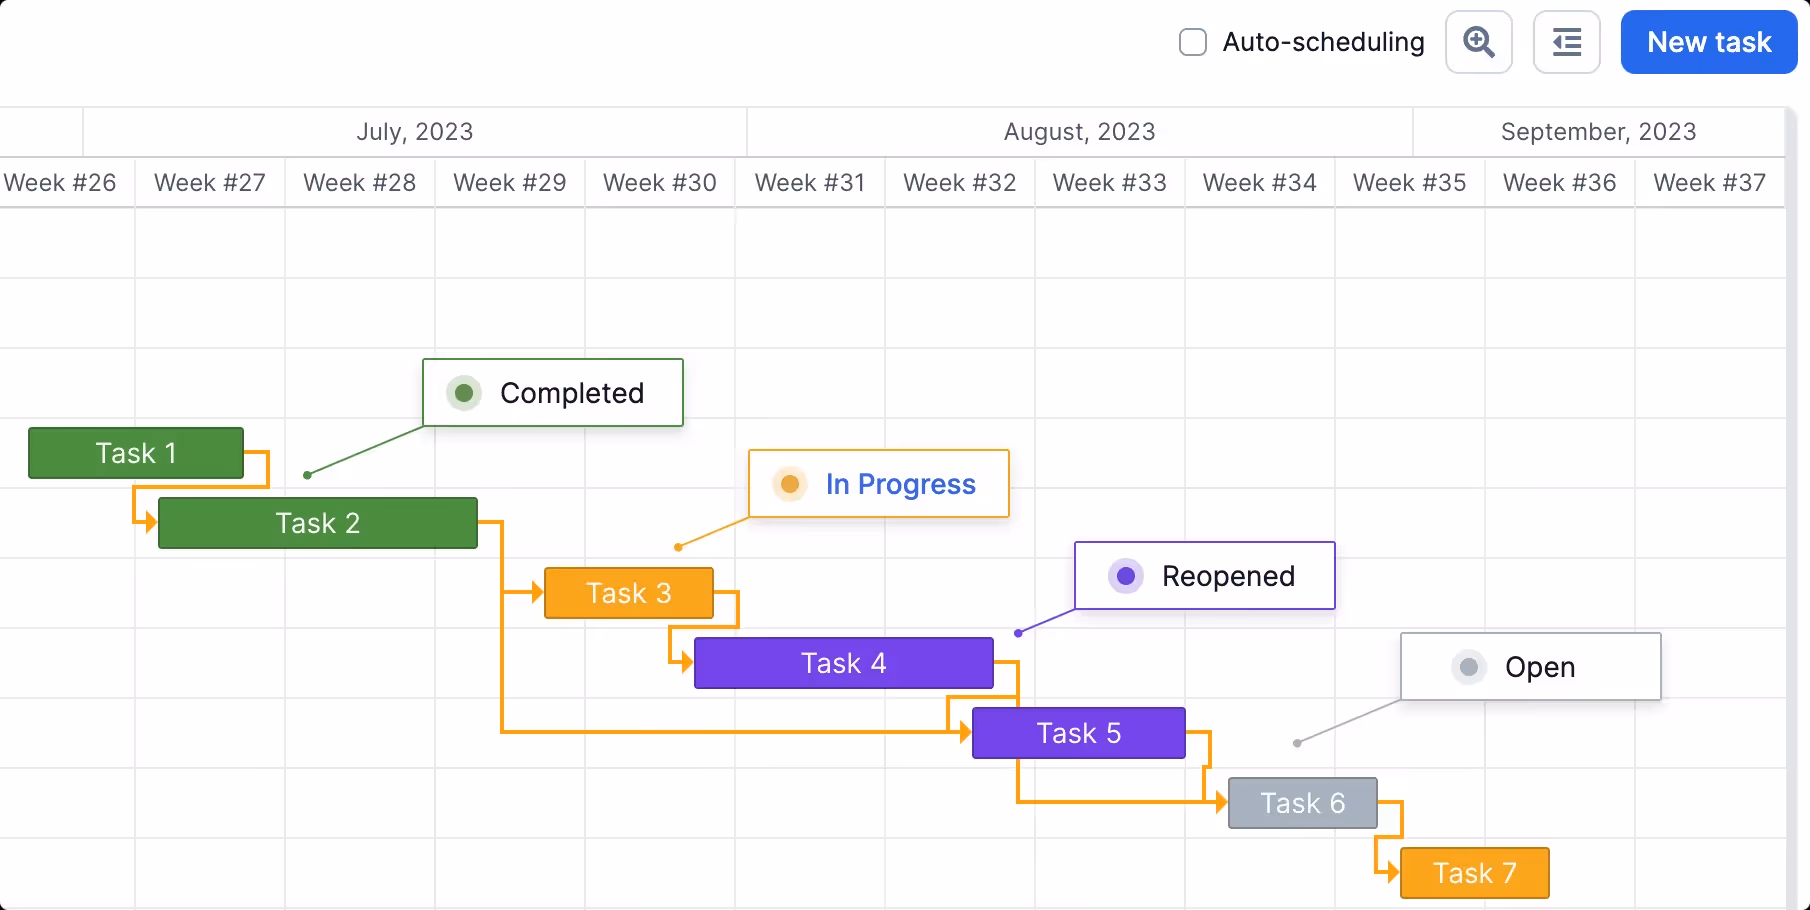
Let's zoom in on the anatomy of the Gantt. On the left side, you can find a list of tasks, together with their statuses, start and due dates, assignees, and priorities. On the right side, the tasks are showcased in a bar form, with yellow arrow lines showing the dependencies between tasks. If you hover over an item, a tooltip appears for easy visualization of the task at a glance.

Our new Gantt Chart empowers you to create, edit, and manage tasks. Each task is created using the existing "New task" button in the top right corner, a familiar tool for DealRoom users. When you need to move, modify, or even remove a task, you can do so directly within the Gantt view.
Each task can also be organized under workstreams or functional areas. This gives you the flexibility to structure your integration project in a way that best suits your team's needs. In essence, teams can design, adapt, and perfect their integration journey with much more efficiency.
During M&A, especially during the integration process, it's crucial for teams to maintain accurate, up-to-date, visual representation of the deal's process, allowing them to strategically plan core activities.
The color-coded bars act as a progress bar, giving you a clear picture of how far you've come and how far you need to go. See a visual representation of task status below:
Workstream status represents the overall status of integration. This is indicated by the workstream's progress bar - whenever a task within a workstream gets completed, a part of this bar darkens, showing the % of the workstream completetion. Example: There are 10 individual tasks under a single workstream - if your team completes 2 tasks, 20% of the workstream's bar darkens, indicating the amount of work completed.
Based on the number of resolved tasks within a category, it gives you a clear picture of how far you've come and how far you need to go.

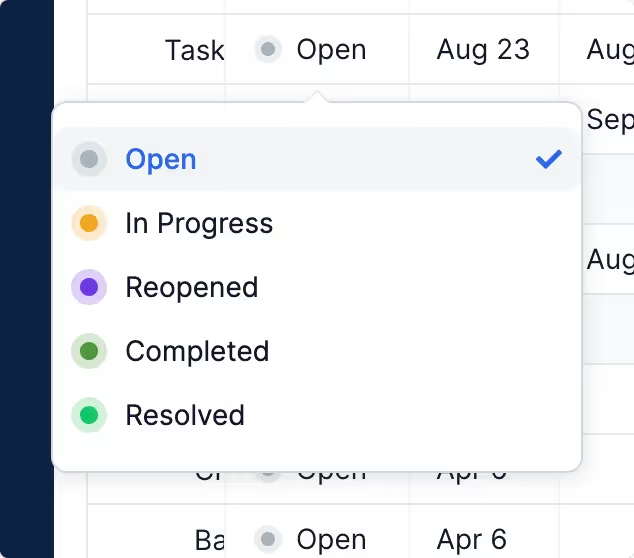
Each task uses its status color for its bar, providing a clear, visual representation of your project's status at a glance. Pick from open, in-progress, reopened, completed, or resolved task status.
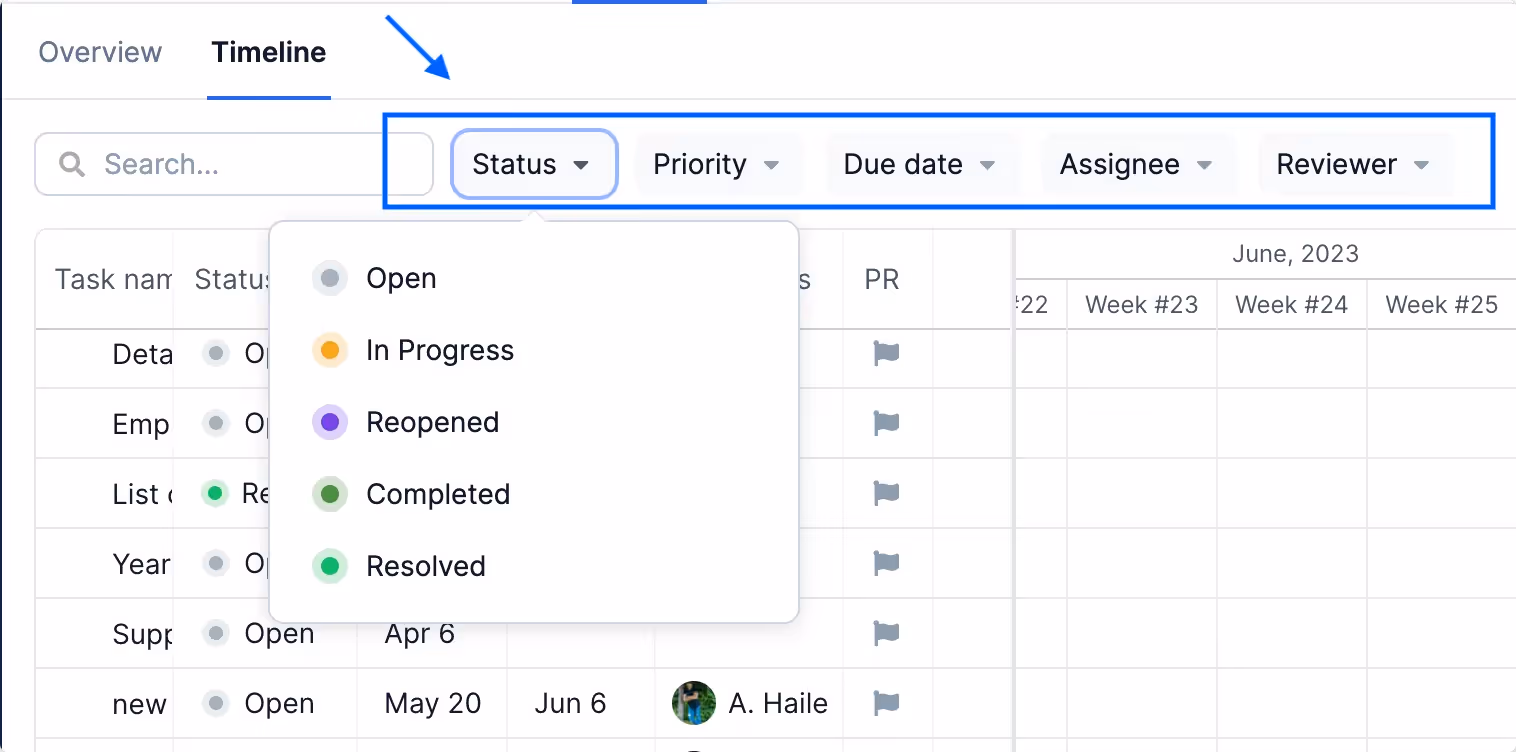
As you progress on your journey, you need a way to track your status. Our Gantt chart feature provides you with a comprehensive dashboard that enables users to set, as well as sort and filter by options, such as: status, priority, due date, assignee, and reviewer. This keeps you informed and in control, and ensures that you have all the necessary information at your fingertips, enabling you to manage integration or other processes effectively.
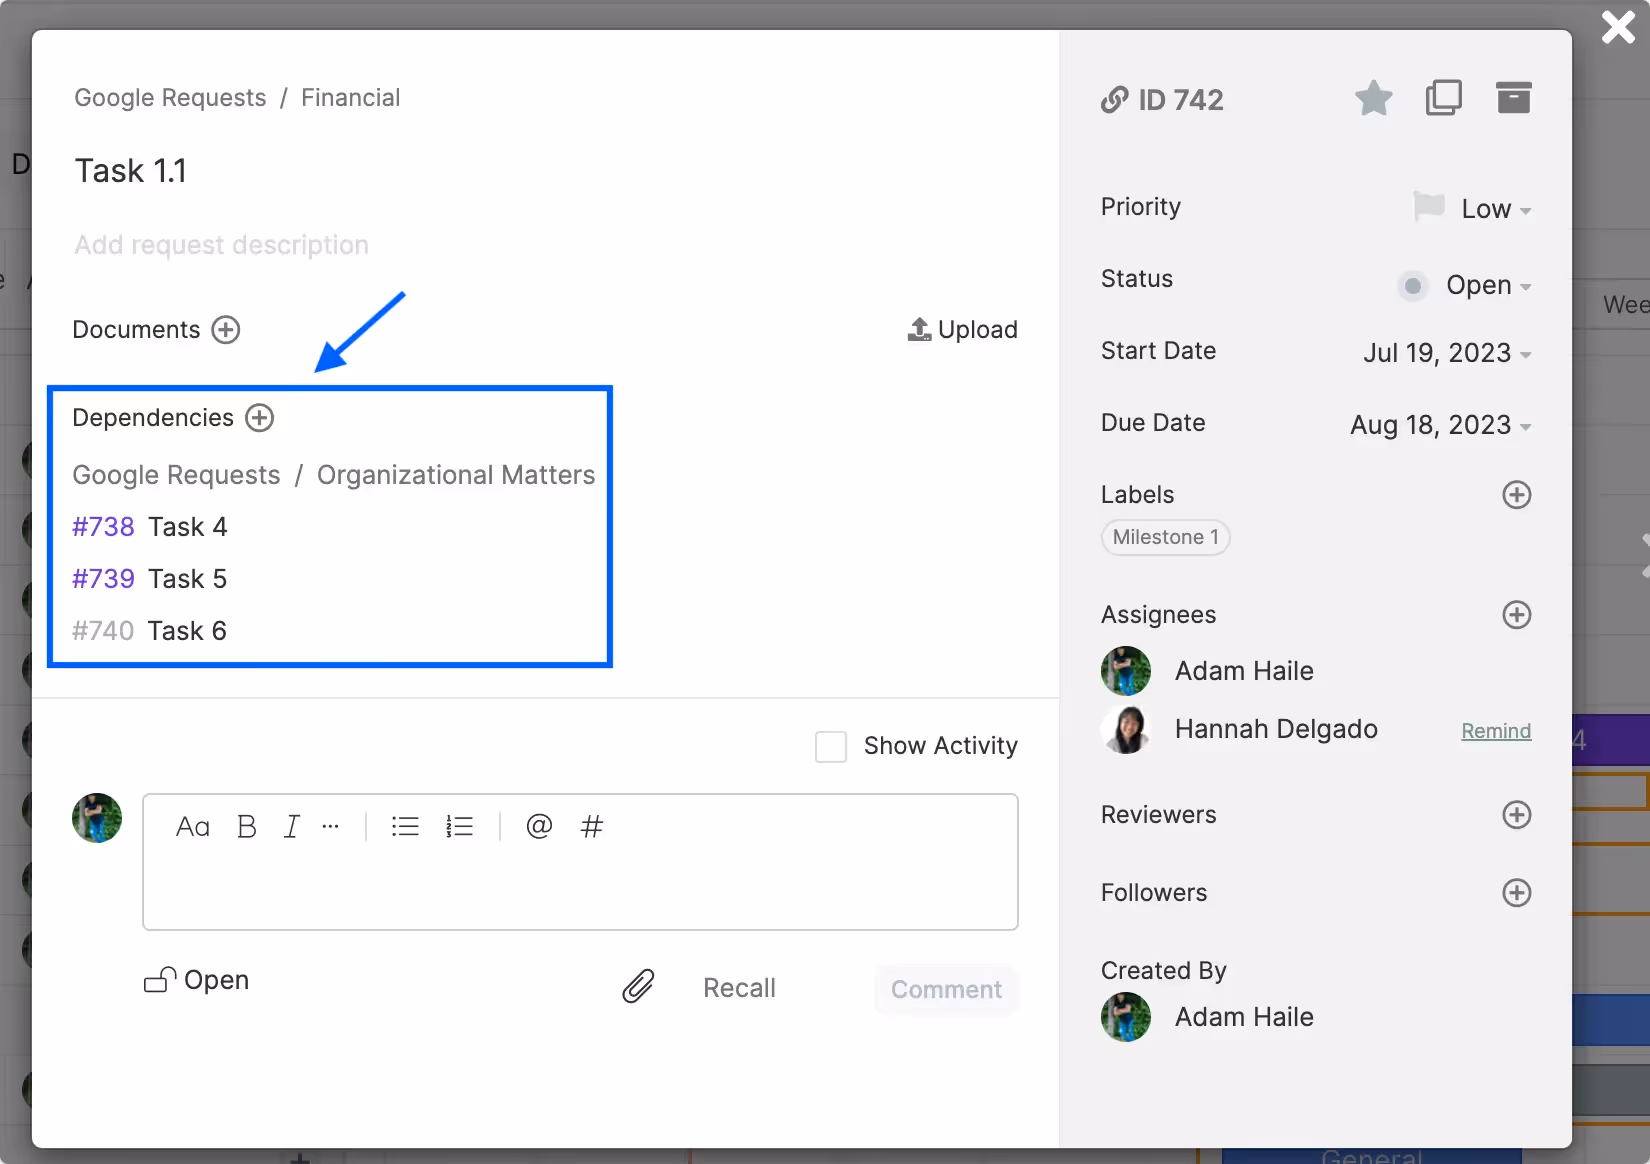
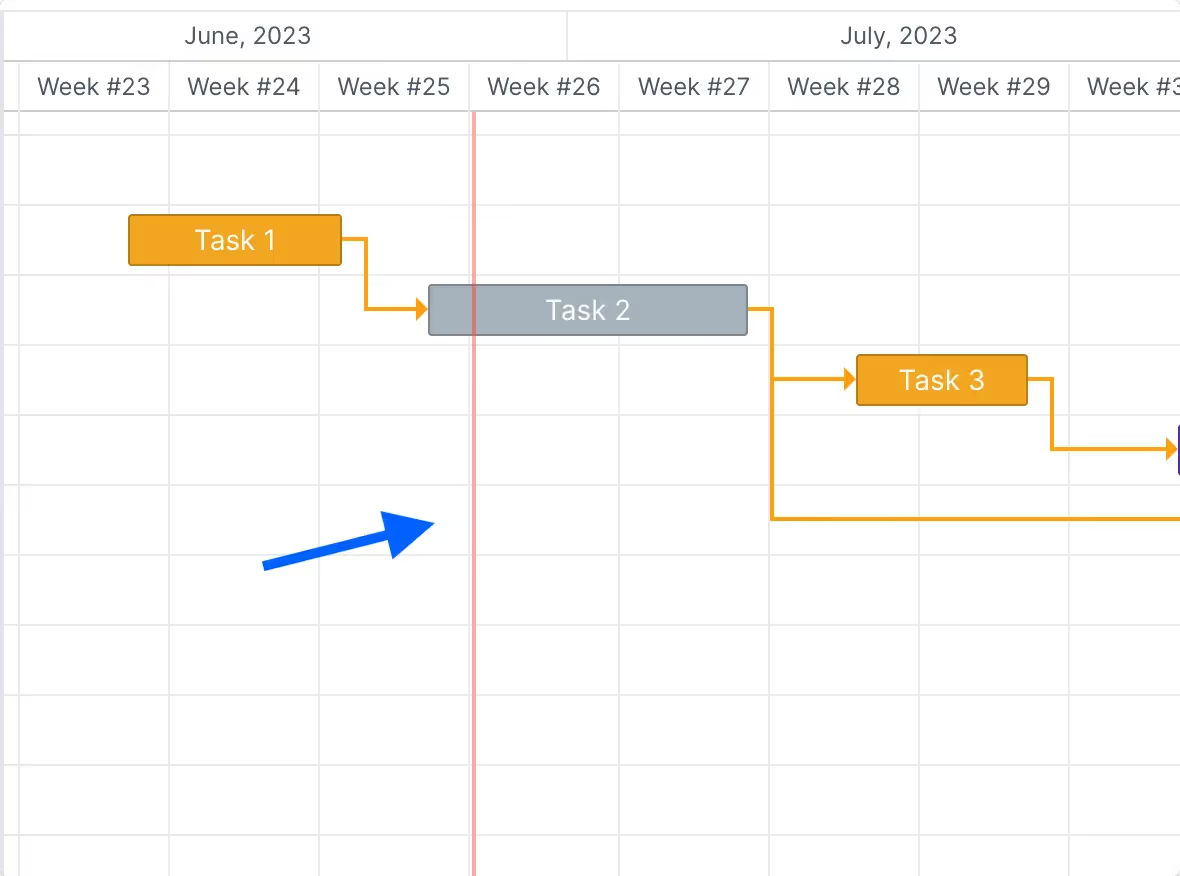
Especially when it comes to integration, some stops depend on others. You can't visit Stop B until you've reached Stop A. The Gantt chart allows teams to easily visualize dependencies between their tasks with arrow lines. The dependency line connects a task with another task that is immediately dependent upon its completion, with the arrow pointing to the dependent task (see below).
You can drag the arrow from one task to another, which also marks the task as a dependency. Alternatively, you can assign dependencies by clicking on the "+" icon after clicking on the task's timeline bar.
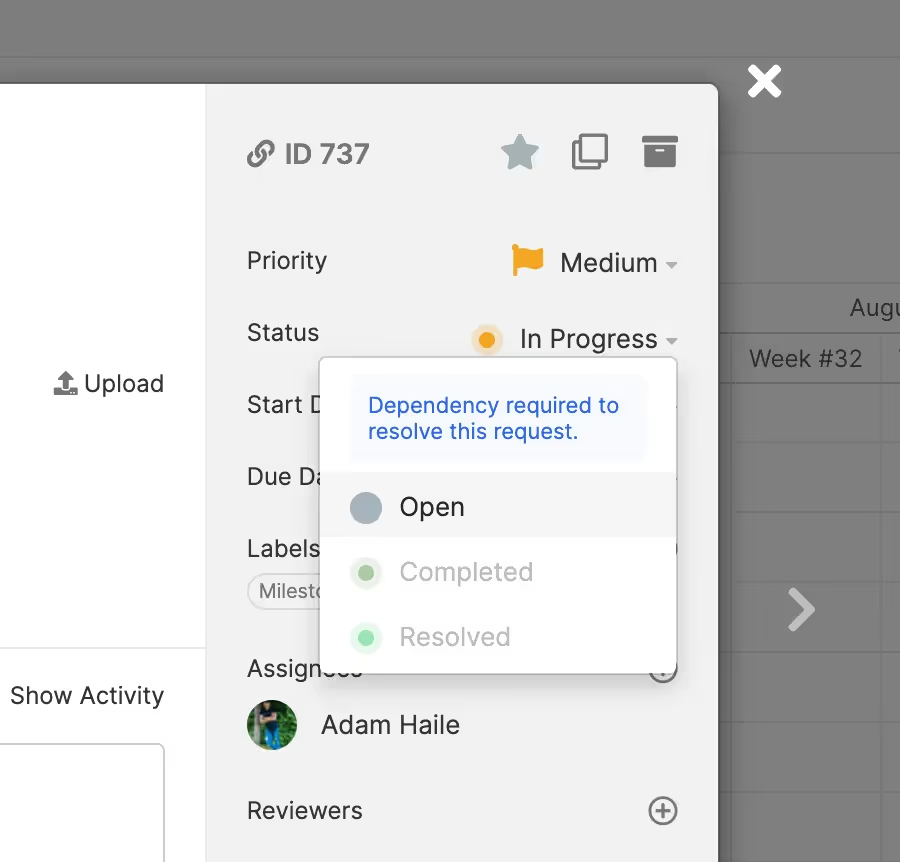
A task with dependency can only be marked as 'resolved' when a task with assigned dependency has previously been marked as resolved.
And the best part? Teams can easily shift dependencies when the project's timeline changes. You can pick any delayed task, and its corresponding dependent tasks will be moved by the requisite number of days. Simply select any task's bar and drag it by the amount of days it has been delayed. This change immediately reflects in your left panel view.

You can use the dropdown menu to view your Gantt chart in days, weeks, months, quarters, or years.

The red vertical bar running through the chart is an indicator of today's date, allowing teams to clearly visualize and immediately understand where they stand relative to the start and end dates of the task and project.
Have you ever had a task slip through the cracks for far too long because nobody was sure who's responsibility it was? These days are far gone. In the Gantt view, you can assign responsibility and accountability for each task, ensuring responsibilities are clear for every task.
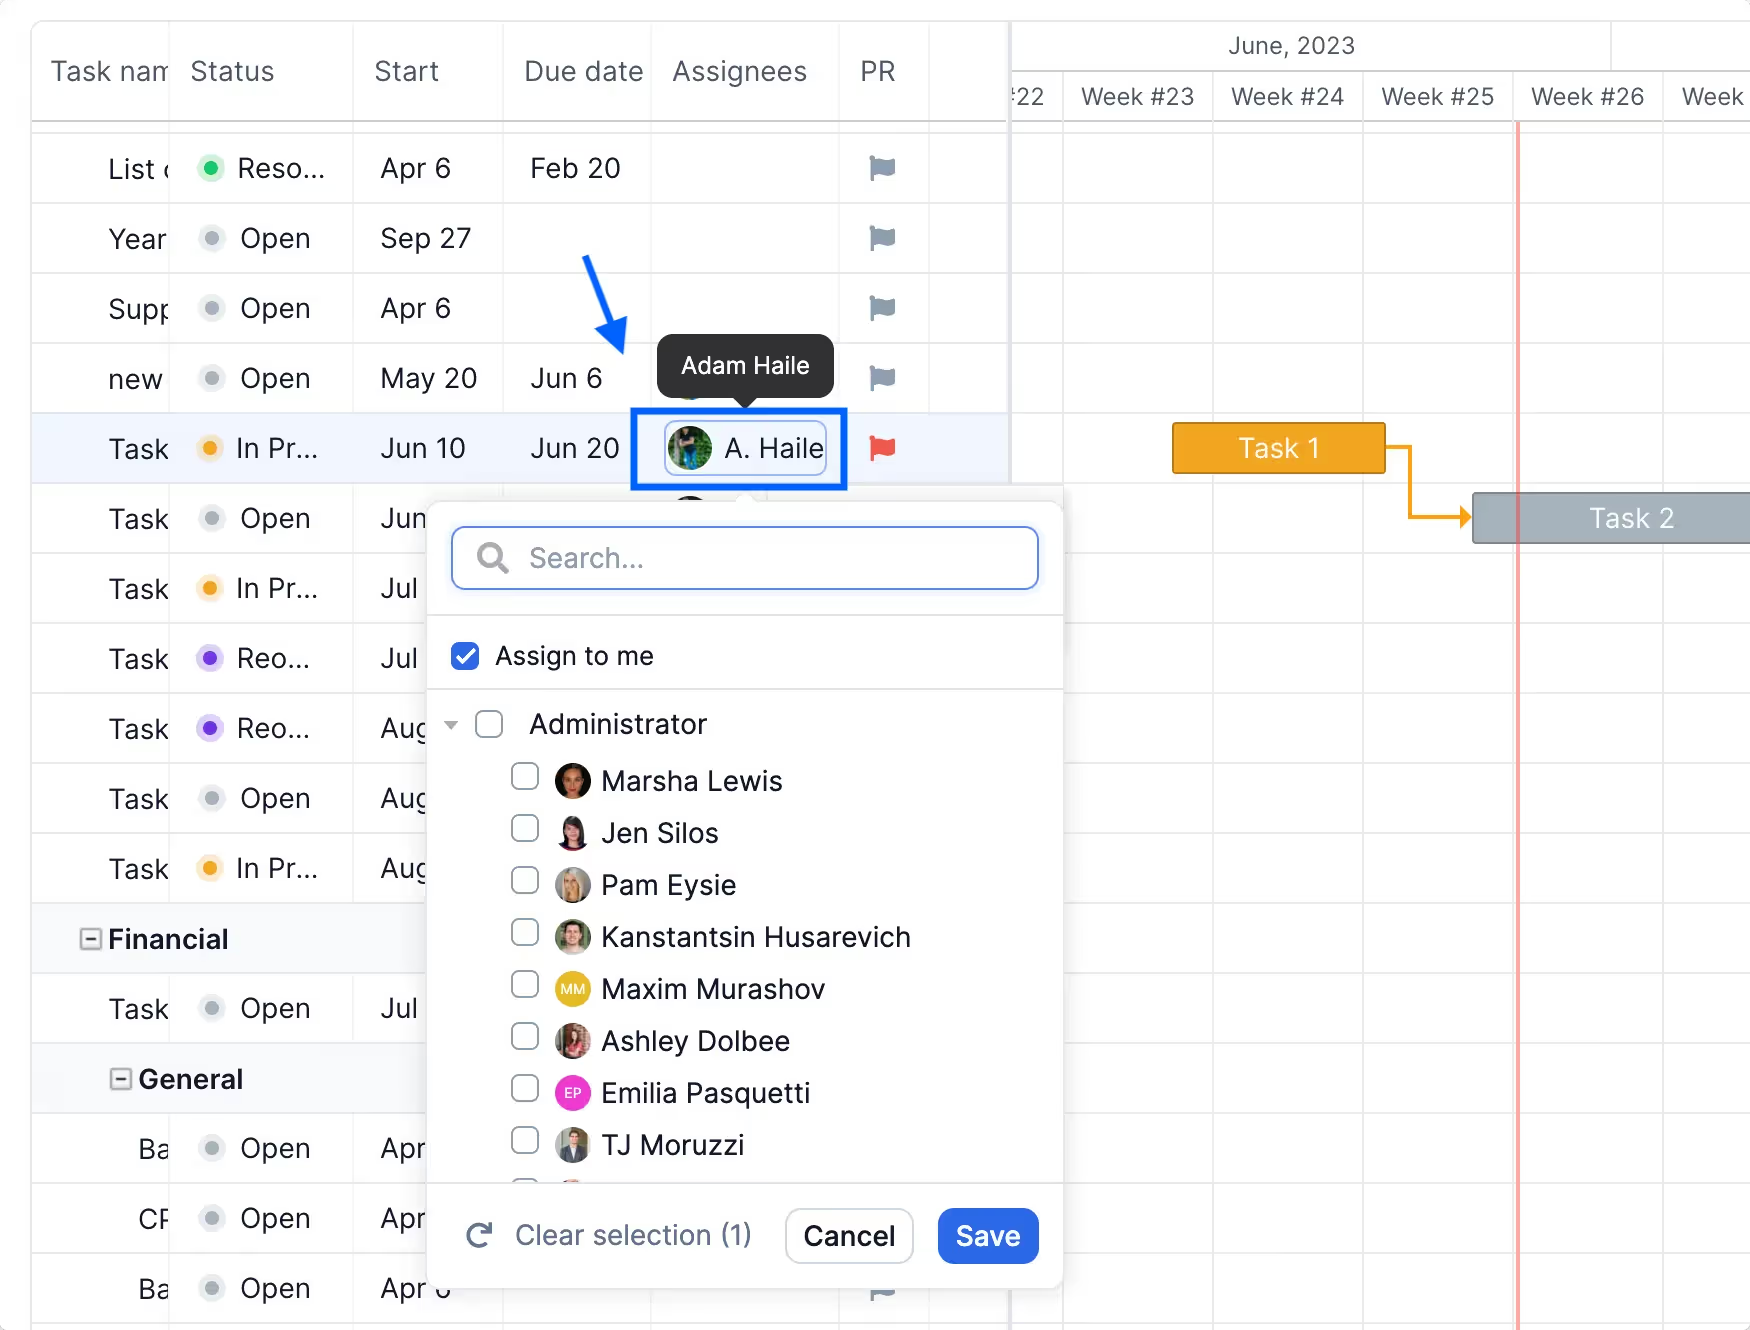
To assign a user/user group to a task, simply navigate to the 'Assignees' column and click on the item's cell. Then, choose users from the dropdown list. You can also assign the task to yourself or pick an entire team (Ie. administrators, marketing, sales..).
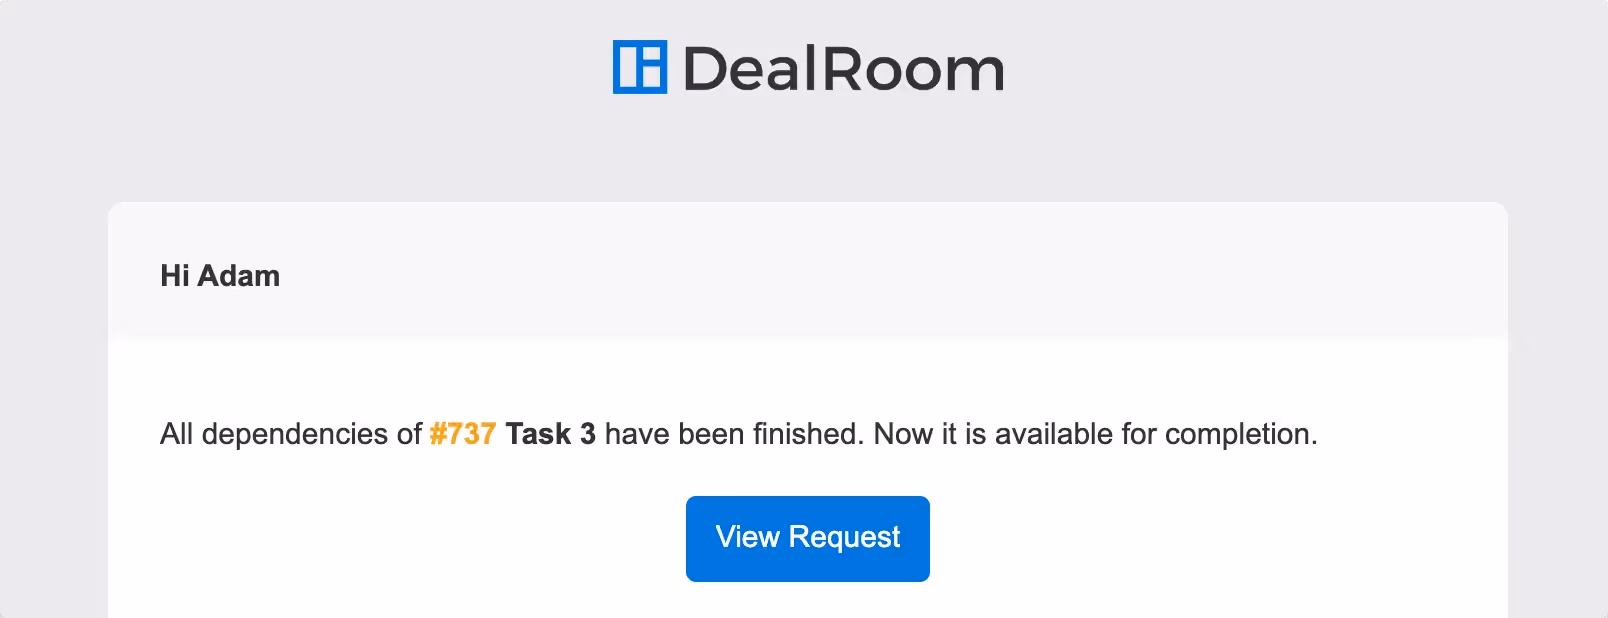
Every member you assign to a task receives a notification of the assignment. An assignee receives an email notification once all dependencies have been resolved, allowing him/her to mark his task as completed/resolved.
Coming soon!
If you have any questions, please reach out to our team right here. We’re available 24/7 and happy to help.